Graph Building Using Google Sheets
In this activity, students will use Google Sheets to compile their collected data from Activity 1 into graph form.
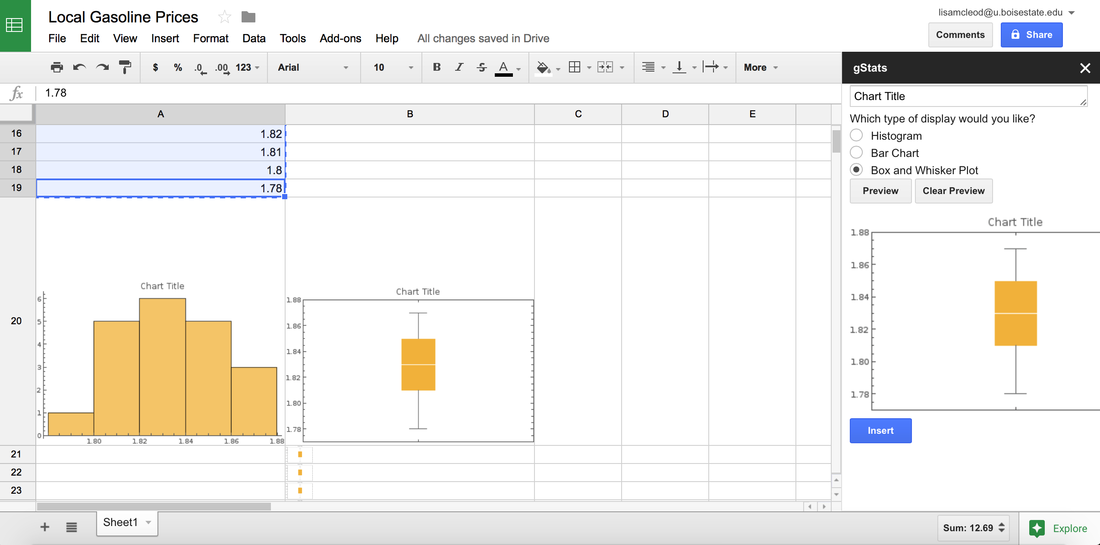
1. Students will enter compiled data into one or more Google Sheets according to teacher directive.
2. Students will find and add the gMath app to their Google sheets.
3. Students will work in groups to create a histogram, box plot and line graph from each set of data, broken down by group preference. Some ideas include local prices vs. national prices, US prices vs. Global prices, state vs. state, etc.
4. Each group will be responsible for a short discussion about how they graphed their data and what they learned from their graphs. Any outliers should be acknowledged, and the impact on the graph should be included in the discussion. Measures of central tendencies (mean, median, mode) and range should also be included.